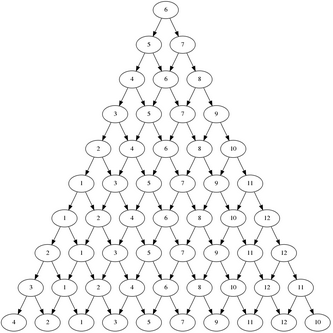
A strict directed graph
Posted by Jonas Elfström Sat, 23 Oct 2010 22:39:00 GMT
Recently N. asked a question on a list that made my geek-senses tingle. He had a test with 12 levels of questions. The testee should answer 10 questions. If a question was answered correctly the level would go up and if it was not correct it would go down. If a level 12 was answered correctly, another level 12 would be asked and vice versa. The first question would be a level 6. N. wanted to know how many questions of each level he needed.
Pretty soon he got a correct answer and several wrong. One of the incorrect answers was, and I don't like to admit this, provided by me. I took the recursive route (which I very seldom do) and then tried to present the result in ASCII. I failed. The result from the algorithm in itself was correct but the presentation was simplified so much it failed to deliver the correct answer. Here it is:
             06
            05 07
          04 06 08
         03 05 07 09
       02 04 06 08 10
      01 03 05 07 09 11
    01 02 04 06 08 10 12
   01 02 03 05 07 09 11 12
 01 02 03 04 06 08 10 11 12
01 02 03 04 05 07 09 10 11 12
The problem is that this result can be read as if the testee could get two level 2 questions in a row but the rules forbids that.
Then I remembered reading about Graphviz and especially Ruby-Graphviz. That's what I used to generate the graph to the right. The graph itself is nothing but a visualization of all the possible question sequences. To find the answer that N. was looking for you can follow a level from top to bottom and count the number of times it can occur. I have to admit that it's far from the most convenient way but it works.
The result
5 of level 1, 5, 6 & 7.
4 of level 3, 4, 8, 9 & 12.
3 of level 2, 10 & 11.
I had to jump a few hurdles to get there. First my old Ubuntu-install, for unknown reasons, had some ancient version of libfreetype in /usr/local/lib/ that I had to remove. In the end an rm /usr/local/lib/libfreetype* would have been good. I also did a sudo ldconfig but I'm not sure that was necessary. Let's just hope you're on a modern system where a sudo apt-get install graphviz followed by sudo gem install ruby-graphviz will be enough.
The recursive code I wrote produces every single path the testee can take. A graph of that would be quite big since it's 1023 nodes. I then found out about strict digraph in the Graphviz DOT language. It sounded like a perfect fit and it was! One problem though, Ruby-Graphviz didn't seem to know about it. The power of open source software let me patch ruby-graphviz-0.9.18/lib/graphviz/constants.rb so that GRAPHTYPE included it
1 2 3 4 |
## Const: graphs type GRAPHTYPE = [ "digraph", "graph", "strict digraph" ] |
Another awesome power of open source is Grégoire Lejeune because only hours after me contacting him he added it to the GitHub repository.
Here's the code that produced the Rooted Binary Directed Acyclic Graph (or is it Rooted Directed Binary Acyclic Graph?).
1 2 3 4 5 6 7 8 9 10 11 12 13 14 15 16 17 18 19 20 21 22 23 24 25 26 27 |
require 'rubygems' require 'graphviz' @min_level=1 @max_level=12 @max_depth=10 start_level=6 @g = GraphViz.new(:G, :type => "strict digraph" ) def add_node(level, depth, parent) if depth<@max_depth current=[level, depth].join(",") sub=level<=>@min_level add=@max_level<=>level add_node(level-sub, depth+1, current) add_node(level+add, depth+1, current) @g.add_node(current).label=level.to_s @g.add_edge(parent, current) unless parent=="00" end end add_node(start_level, 0, "00") @g.output( :png => "graph.png" ) |
With the current parameters this problem might not be the most exciting but I believe that by just modifying them slightly we would, again, reach a wall of complexity.

